DATA · MANUFACTURING

SPC DASHBOARD

Control charts, rule signals, and capability calculations for exploring a synthetic oxide-thickness process.

Python · Dash · Plotly · pandas · Matplotlib

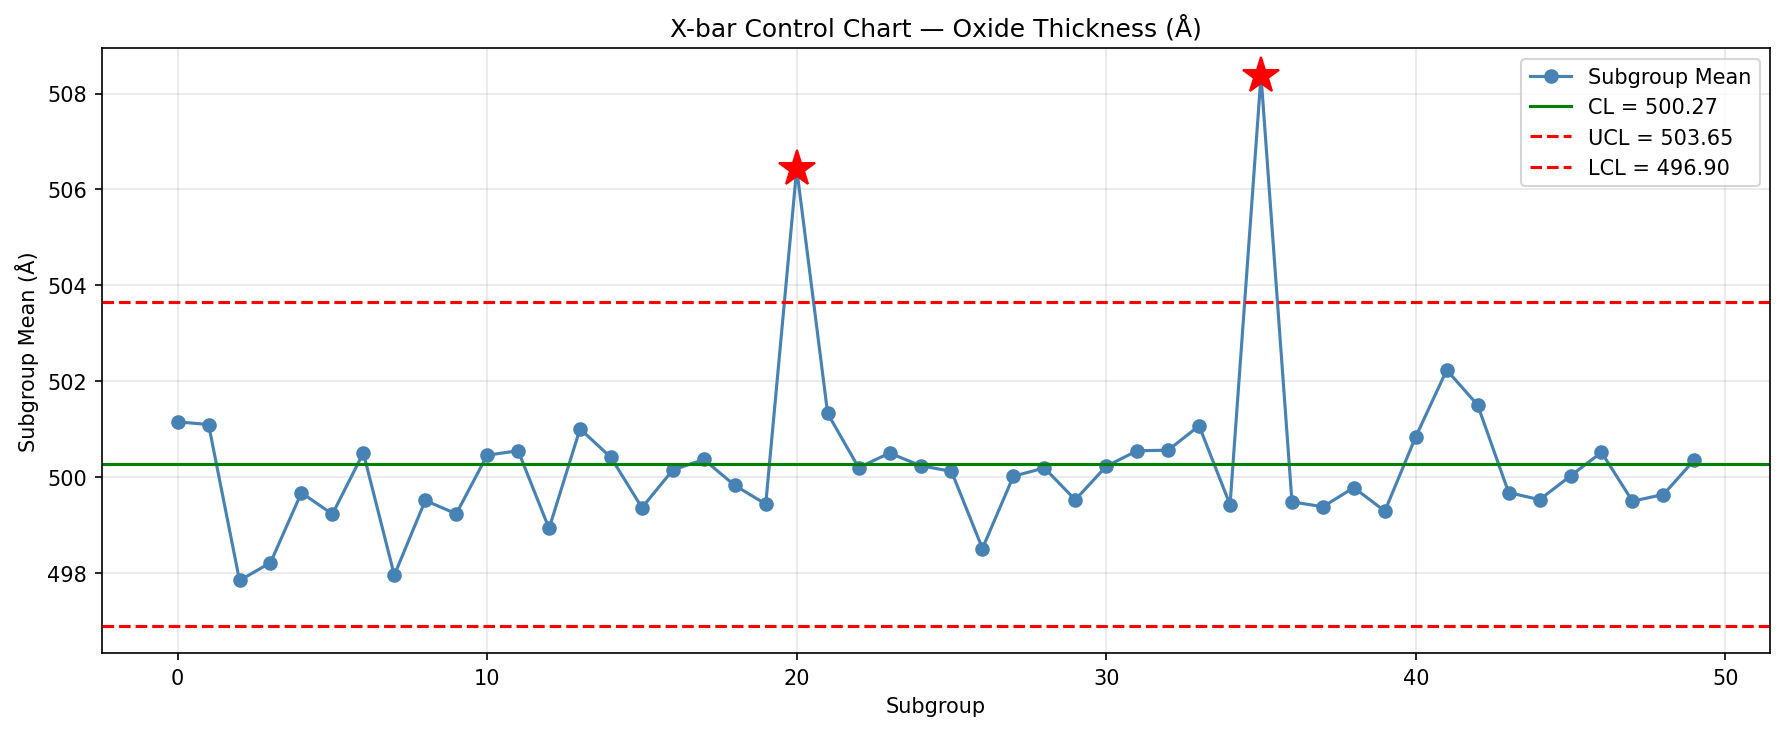
X-bar control chart with two injected synthetic out-of-control signals
Verified exported X-bar chart from the synthetic SPC analysis

PROJECT SNAPSHOT

From subgroup measurements to investigation signals

Type
Local analytics dashboard
Status
No maintained live deployment
Technologies
Python, Dash, Plotly, pandas, Matplotlib
  • X-bar and R control charts
  • Four corrected primary Western Electric rules for X-bar data
  • Cp, Cpk, Cpu, Cpl, and estimated process sigma
  • Editable specification limits with validation
  • Chronological signal table and static chart export

Technical details

The application calculates subgroup statistics, estimates within-subgroup sigma from R-bar and d2, and keeps engineering specification limits separate from statistical control limits. Symmetric zone rules are limited to the X-bar chart; the asymmetric R chart uses its calculated limits.

The included dataset models 50 synthetic subgroups of five measurements and intentionally injects special-cause events for demonstration.

Verification & limitations

Thirteen automated regression tests pass locally, covering corrected rule boundaries, same-side requirements, R-chart scope, and specification validation. Remote CI validation remains pending.

This is an educational analysis tool, not a manufacturing control or lot-disposition system. The portfolio shows the verified exported chart; the interactive dashboard currently runs locally.